Infographics
Infographics design turns complex information into clear, engaging visual stories. We create purposeful infographics, diagrams, icon systems and data visualisations for reports, campaigns, presentations, websites and social media.

Making information easier to understand
A good infographic simplifies information without oversimplifying the message. We identify the most important relationships, comparisons and patterns before developing a visual structure that guides the reader logically.
Our work includes statistical graphics, process diagrams, timelines, maps, comparison graphics, custom icons and modular visual systems. Each piece is designed around the audience, context, accessibility and accurate representation of the source information.
What is an infographic?
An infographic is a visual way of presenting information, data or a process. It combines text, icons, illustrations, diagrams and charts to make complex content quicker and easier to understand.
Why are infographics effective?
Infographics help audiences identify key messages quickly, understand relationships between facts and remember information more easily than they might from a page of text or data alone.
What information can be turned into an infographic?
Statistics, survey results, timelines, processes, comparisons, research findings, impact data, service information and step-by-step guidance can all be transformed into clear visual content.
Can you create animated infographics?
Yes. We can animate charts, icons, statistics and diagrams for social media, presentations, websites, campaigns and video content.
Can you work with complex data sets?
Yes. We can help review and organise the information, identify the most important messages and turn detailed data into a clear visual hierarchy without losing accuracy.
Can infographics be used in annual reports and presentations?
Yes. Infographics work particularly well in annual reports, impact reports, presentations, campaigns, websites and social media, and can be adapted into multiple formats for different channels.
How long does it take to create an infographic?
Timescales depend on the amount and complexity of the information, the required style and the number of formats. A straightforward infographic may take a few days, while a detailed data-led piece may require more time for planning, checking and refinement.
What’s included
- Data visualisation
- Statistical infographics
- Process diagrams
- Timelines
- Maps
- Comparison graphics
- Custom iconography
- Icon systems
- Explainer graphics
- Report infographics
- Campaign graphics
- Presentation graphics
- Social media infographics
- Accessible visual design
Projects using infographics and illustration
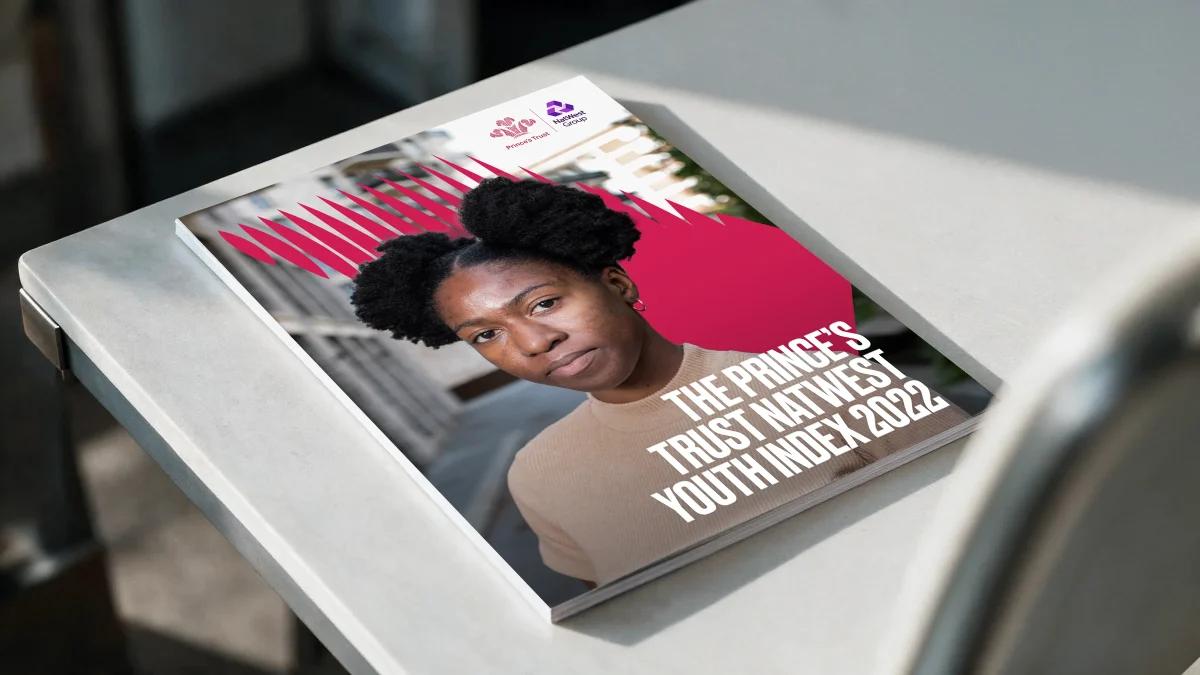
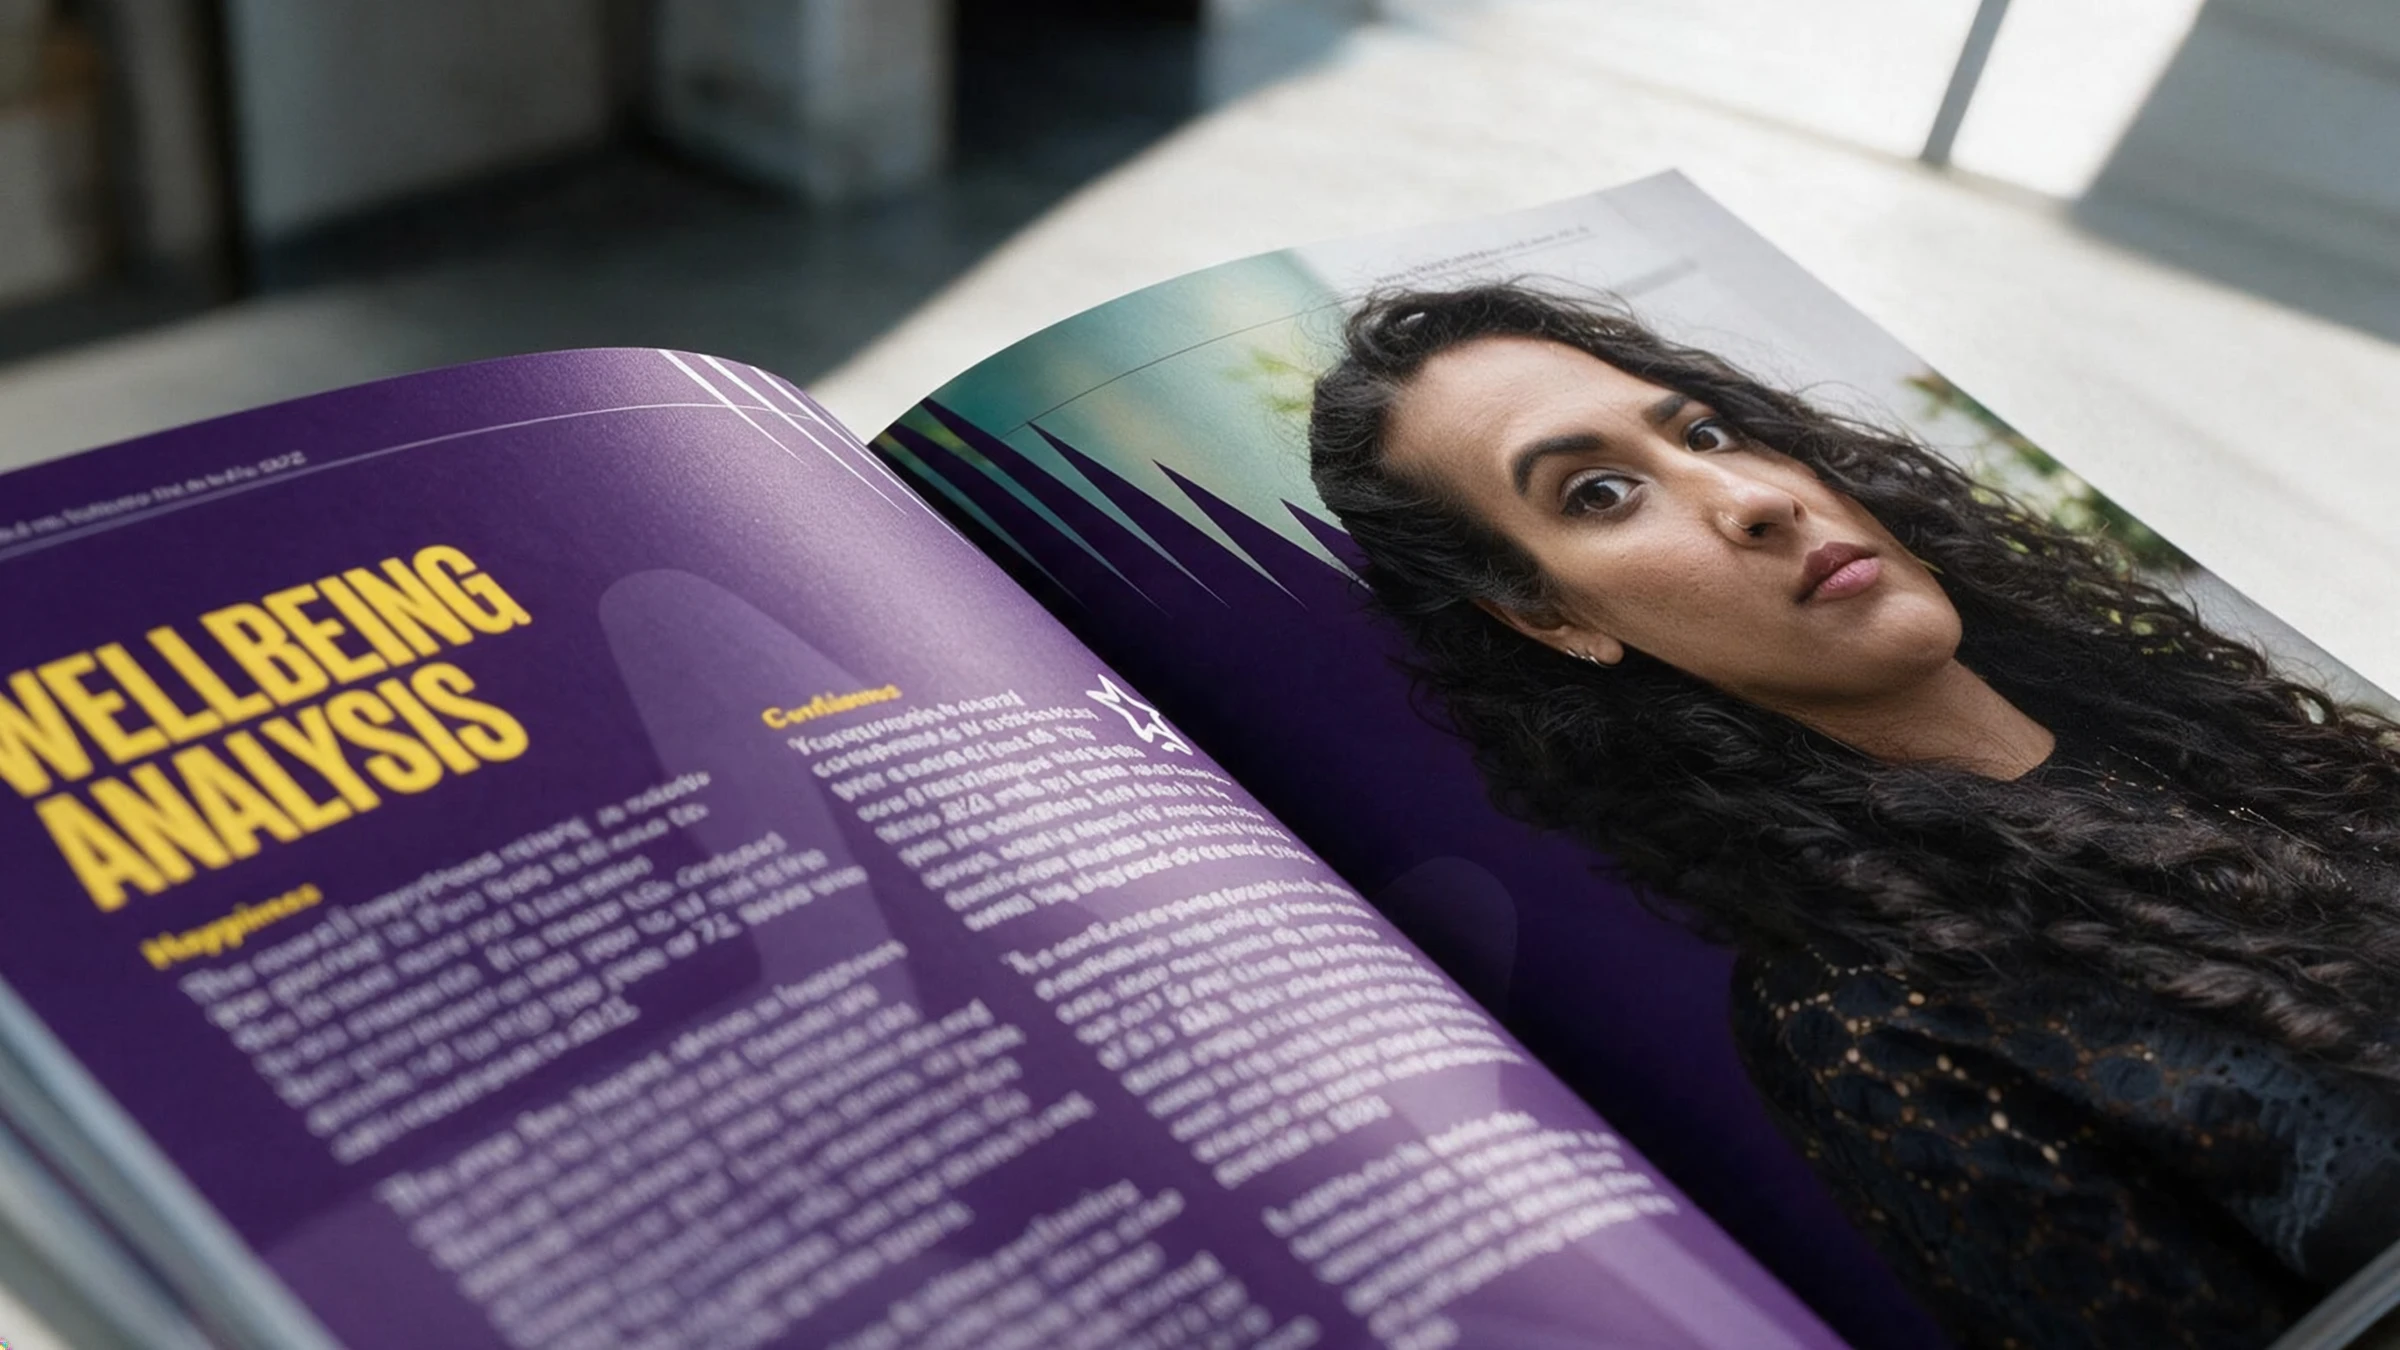
The Prince’s Trust Youth Index Report
A clear and engaging report built around stories and data.
View project: The Prince’s Trust Youth Index Report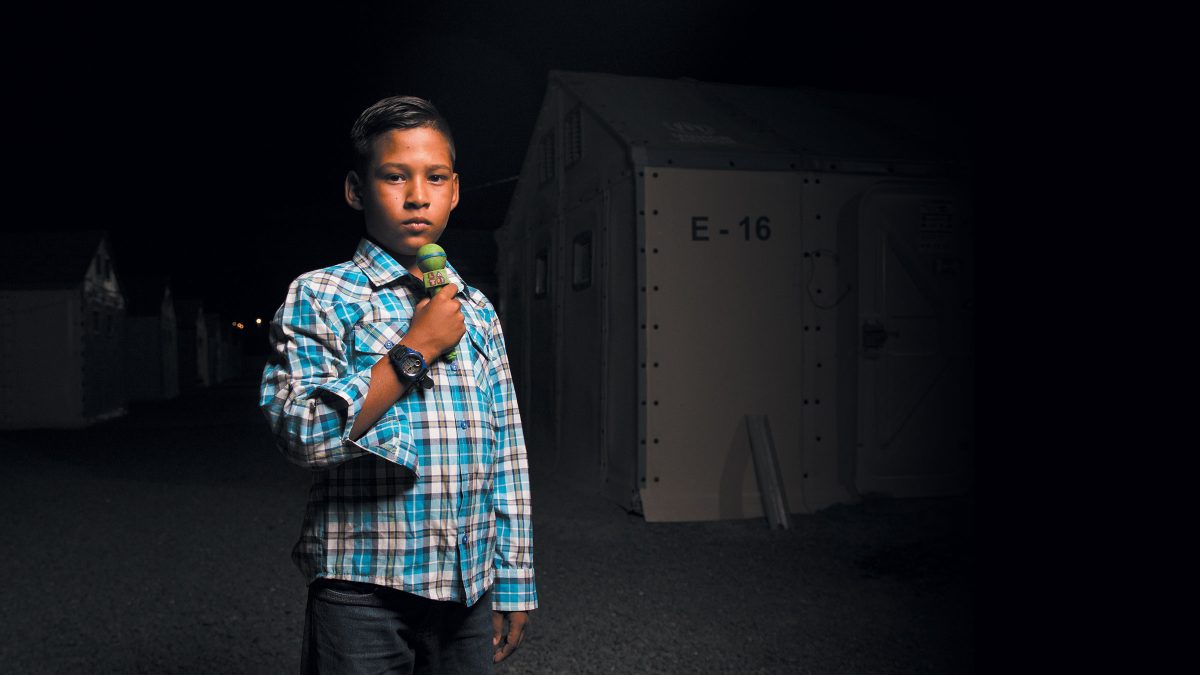
UK for UNHCR Annual Report Design
Transforming stories and statistics into an engaging annual review.
View project: UK for UNHCR Annual Report DesignOur design services
Branding
Building a distinctive brand through strategy, visual identity, logo design and brand guidelines that help organisations stand out.
Graphic Design
Creative graphic design for print and digital, from brochures and publications to advertising, marketing materials and branded communications.
Campaign Design
Creative campaigns across print, digital and outdoor media that capture attention and communicate your message consistently.
Annual Report Design
Transform complex information into engaging annual reports with thoughtful layouts, data visualisation and compelling storytelling.
Digital Design
Create engaging digital experiences for websites, social media and online campaigns that strengthen your brand and connect with audiences.
Motion Graphics
Bring ideas to life with motion graphics, animation and explainer videos that communicate complex messages with clarity and impact.
Exhibition Design
Transform exhibition spaces with thoughtful design, striking graphics and cohesive branding that encourages meaningful engagement.
Event Branding
Create memorable event experiences through distinctive identities, exhibition graphics, signage, presentations and digital assets.
Infographic Design
Create clear, engaging infographics and custom icons that turn complex information into compelling visual communication.